Viewing Data
This section describes the available tools to view data.
Using the Entity Tree
The Entity tree presents the structure of entity classes and entities in all databases in the shape of a tree:
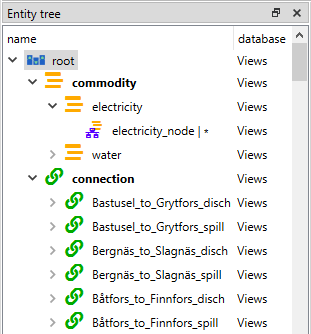
To view all entities of a class, expand the corresponding entity class item.
To view all multidimensional entities where a specific entity is an member, expand that entity.
Tip
To extend the selection in Entity tree, press and hold the Ctrl key while clicking on the items.
Right clicking items in the Entity tree will open up a context menu. Depending on what kind of item the menu was opened from (root, entity class, entity, N-D entity) all of the options might not be available. Unavailable options are still visible but they are greyed out:
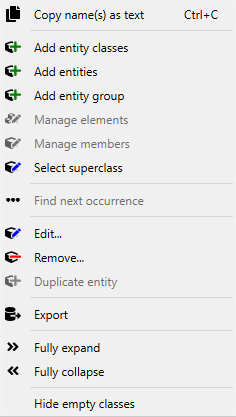
Copy as text copies the data from the selection so that it can be pasted elsewhere.
Add entity classes opens up a dialog to add new entity classes.
Add entities opens up a dialog to add new entities.
Add entity group opens up a dialog to create entity groups.
Manage elements opens up a dialog where new entities can be created or existing ones deleted for a multidimensional entity.
Manage members opens up a dialog to delete or add new members in an entity group.
Select superclass opens up a dialog to set the superclass for a given entity class
Find next occurrence goes to the next occurrence of the N-D entity in the Entity tree and selects it. This can also be done by double-clicking the item.
Edit… opens up a dialog where the name, description, icon and active by default -setting of an entity can be changed.
Remove… removes the selection.
Duplicate entity duplicates the whole entity.
Export creates a new Spine Database in an .sqlite file with all of the relevant data to the selection.
Fully expand expands the selection and all its children.
Fully collapse collapses the selection and all its children.
Hide empty classes whether to show empty classes in the tree or not.
Tip
To expand an item in Entity tree, you can also double-click on the item or press the right arrow. This will only expand the next layer and leave the children expanded or collapsed depending on their previous state. Items in gray don’t have any children, thus they cannot be expanded. To collapse an expanded item, double-click on it again or press the left arrow.
Tip
Expand or collapse all items by selecting Fully collapse/Fully expand from the root item’s context menu.
Tip
Entity tree also supports Sticky selection, which allows one to extend the selection by clicking on items without pressing Ctrl. To enable Sticky selection, select Settings from Menu bar -> File, and check the corresponding box.
Using the Graph View
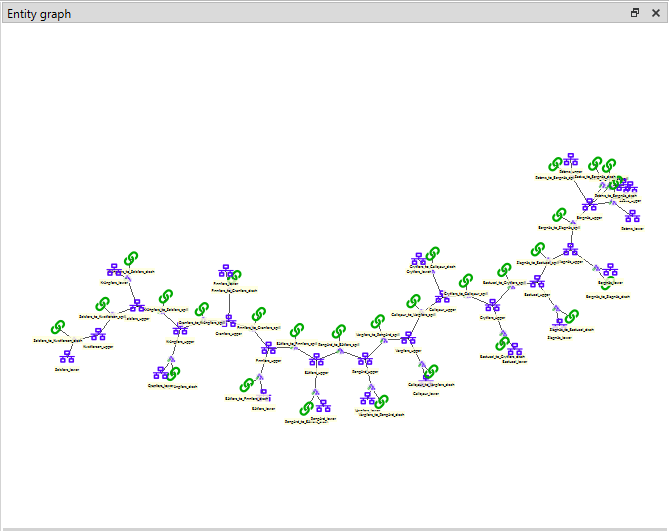
Graph view presents the structure of entities from one database in the shape of a graph:
Building the Graph
The entities included in the graph depend on the selections in Entity tree, Scenario tree and Alternative. These selections can also be combined. This enables for example the inspection of which entities from a specific entity class are included in a certain scenario. This can be done by selecting the scenario and the entity class at once. If selections form Scenario tree or Alternative are present, entities in the graph may get highlighted in certain ways. This is to provide additional information about why the entities are shown in the graph. More on this in the next section.
If the auto-build is enabled, the graph will be built every time the selections in any of these trees changes. Otherwise the graph has to be built manually by clicking the Rebuild button or by pressing F5. Auto-build can be also toggled by pressing Ctrl+F5.
How to use the Entity tree selections to build the graph:
To include all entities from the database, select the root item.
To include all entities of an entity class, select the corresponding class item.
To include specific entities, expand an entity class item and select the corresponding entity items from below.
How the Alternative selections affect the graph:
Selecting an alternative item will include all entities that either have entity alternative activity set as true or have parameters in the corresponding alternative.
How the Scenario tree selections affect the graph:
Selecting an scenario item will include all entities that:
Have entity alternative activity set as active (alternative rank taken into consideration).
Are not specified as inactive with entity alternative in any of the scenarios alternatives, but belong to an entity class that are set as active by default.
Have parameter values in any of the alternatives of the selected scenario.
Selecting an scenario alternative item will act like selecting the corresponding item from Alternative.
Note
In Graph view, a small unnamed vertex represents a multidimensional entity with multiple elements, whereas a bigger named vertex represents a zero dimensional entity. An arc between entities indicates that the 0-D entity is an element of that N-D entity.
The graph automatically includes N-D entities whenever all the elements of that entity are included (even if these entities are not selected in Entity tree). You can change this behavior to automatically include N-D entities whenever any of the member elements are included. To do this, enable Auto-expand entities via the Graph view’s context menu, or from the settings Ctrl+,.
Entity Highlights
As mentioned before, selecting items in Scenario tree and Alternative may cause the entity items in the graph to become highlighted. The highlighting is done by adding a border around the entity item. This is how it looks like:

Note that the icons of the entities or colors don’t change, only the border.
There are four different borders:
No border
If an entity doesn’t have a border, either only Entity tree -selections are present, or the entity is active in the selected alternative/scenario.
Solid
Can be found with scenario selections, if the entity belongs to a class that is set as active by default, and the entity is neither set as active or inactive in the selected scenario.
Dotted
The entity item is present on the graph because it has parameter values in the selected alternative.
Dashed
There are alternatives selected where the entity is set as active and inactive. Essentially means conflict.
Below is a reference for what these different borders look like:

Manipulating the Graph
You can move items in the graph by dragging them with your mouse. By default, each items moves individually. Like in the Design view, multiple items can be moved at once by selecting them first.
To display Graph view’s context menu, just right-click on an empty space in the graph. The context menu has the following options:
Add entities… opens up the add entities dialog, from where new entities can be added.
Search highlights the specified entities with color so that they are easier to visualize.
Hide classes can be used to disable all of the entities from an entity class from showing in the graph. Show can then be used to bring back the hidden classes one by one or Show all to bring them all back.
Prune classes works like Hide classes but it also hides all the classes that have the specified class as an element. Once again these can be brought back one by one with Restore or all at once with Restore all.
Zoom has three options: zoom out, zoom in and reset zoom. Using the scroll wheel of the mouse on the Graph view also works.
Arc-length has two buttons: one for making the arcs between the entities longer and one for making them shorter.
Rotate rotates the whole graph by 15° per step. Also can be done by holding down Shift while scrolling with the mouse wheel.
Auto-expand entities If enabled, the graph will also include entities where the selections are members besides just the selections. if disabled, the graph will only show the selected entities.
Merge databases Whether to merge the databases or not.
Auto-build Toggles whether the graph is built every time tree selections change.
Snap entities to grid makes it so that the placement of the entities can’t be arbitrary anymore but instead they can only lay on a grid.
Max. entity dimension count defines a cutoff for the number of dimensions an entity can have and still be drawn.
Number of build iterations defines the maximum numbers of iterations the layout generation algorithm can make.
Minimum distance between nodes (%) is used for setting the ideal distance between entities in the graph.
Decay rate of attraction with distance The higher this number, the lesser the attraction between distant vertices when drawing the graph.
Select graph parameters is where different aspects of the graph can be mapped to for example parameter values.
Select background image can be used to set any .svg image as the background for the graph.
Save positions Saves the positions of the selected items into the database. To clear the saved position select Clear saved positions.
Save state… saves the drawn graph. Selecting a specific state from Load state… will load that state into the Graph view. Saved states can be deleted from Remove state.
Export as image… can be used to export the image of the graph in either .svg or .pdf formats
Export as video… can be used to export the video of the graph.
Rebuild to rebuild the whole graph.
Note
Graph view supports extended selection and rubber-band selection. To extend a selection, press and hold Ctrl while clicking on the items. To perform rubber-band selection, drag your mouse around the items you want to select.
Note
Pruned items are remembered across graph builds.
To display an entity item’s context menu, just right-click on it. The context menu has a few different options:
To expand or collapse N-D entities, on an entities context menu hover Expand or Collapse and select the entity class from the popup menu.
Connect entities allows the creation of new N-D entities straight from the Graph view. When hovering over the option, the list of relevant multi dimensional entity classes where the selected entity could possibly be a member are shown. After selecting one of the items in the list, the entities that you want to make up the new new entity in the selected entity class can be selected by clicking them in the graph. Once the selections are made, a popup showing the to be added entities is shown. By default every permutation of the selections is staged to be added but individual items can be also deselected.
Edit, Remove and Duplicate work as they do in the Entity tree.
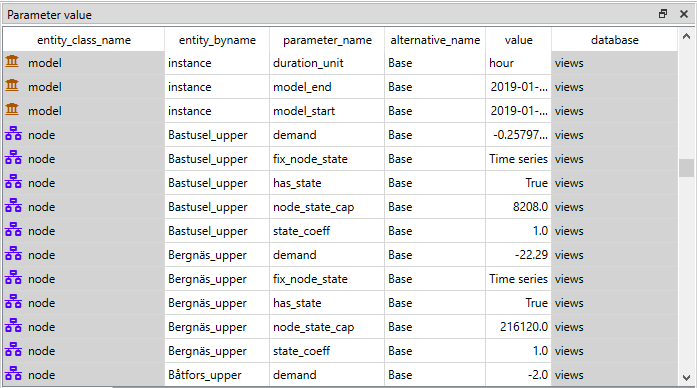
Using Table Views
Table view’s: Parameter value, Parameter definition, Entity alternative and Entity present entity data from all databases in the form of tables:
Similarly to Graph view, the tables in Table view can be filtered by selections in Entity tree, Alternative and Scenario tree. Hold the Ctrl key while selecting to extend the selection across the trees and tables.
Additionally, entity selections in Graph view also filter the Table view tables. This filter is applied cumulatively to the entities and classes selected in Entity tree.
Note, that Alternative selections do no affect the Entity table.
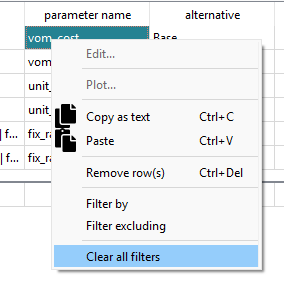
To remove all these filters, simply select the root item in Entity tree or deselect all items from Alternative and Scenario tree. Additionally, the filters be cleared with the Clear all filters item available in the right-click context menu of any of the Table view tables:
To apply a custom filter on a Table view, click on any horizontal header. A menu will pop up listing the items in the corresponding column:
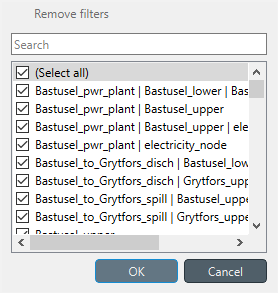
Uncheck the items you don’t want to see in the table and press Ok. Additionally, you can type in the search bar at the top of the menu to filter the list of items. To remove the current filter, select Remove filters.
To filter a Table view according to a selection of items in the table itself, right-click on the selection to show the context menu, and then select Filter by or Filter excluding. To remove these filters, select Remove filters from the header menus of the filtered columns.
Tip
You can rearrange columns in Table Views by dragging the headers with your mouse. The ordering will be remembered the next time you open Spine DB editor.
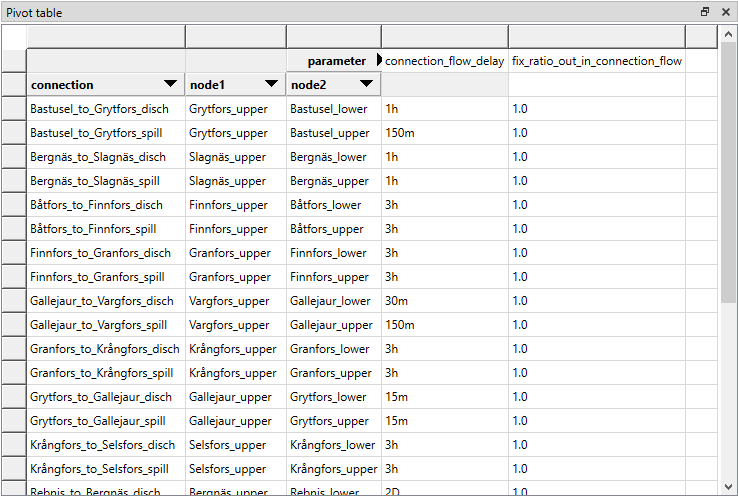
Using Pivot View and Frozen Table
Pivot view and Frozen table present data for an individual class from one database in the form of a pivot table, optionally with frozen dimensions:
To populate the tables with data for a certain class, just select the corresponding class item in Entity tree.
Selecting the Input Type
Pivot view and Frozen table support four different input types:
Value (the default): it shows entities, parameter definitions, alternatives, and databases in the headers, and corresponding parameter values in the table body.
Index: Similar to the above, but it also shows parameter indexes in the headers. Indexes are extracted from special parameter values, such as time-series.
Element: it shows entities, and databases in the headers, and corresponding multidimensional entities in the table body. It only works when a N-D entity is selected in the Entity tree.
Scenario: it shows scenarios, alternatives, and databases in the header, and corresponding rank in the table body.
You can select the input type from the Toolbar.
Note
In Pivot view, header blocks in the top-left area indicate what is shown in each horizontal and vertical header. For example, in Value input type, by default, the horizontal header has two rows, listing alternative and parameter names, respectively; whereas the vertical header has one or more columns listing entity names.
Pivoting and Freezing
To pivot the data, drag a header block across the top-left area of the table. You can turn a horizontal header into a vertical header and vice versa, as well as rearrange headers vertically or horizontally.
To freeze a dimension, drag the corresponding header block from Pivot view into Frozen table. To unfreeze a frozen dimension, just do the opposite.
Note
Your pivoting and freezing selections for any class will be remembered when switching to another class.
Tip
If you are not seeing the data you think you should be seeing, it might be because there is some selection active in the Frozen table that is filtering those values out of the Pivot view.
Filtering
To apply a custom filter on Pivot view, click on the arrow next to the name of any header block. A menu will pop up listing the items in the corresponding row or column:
Uncheck the items you don’t want to see in the table and press Ok. Additionally, you can type in the search bar at the top of the menu to filter the list of items. To remove the current filter, select Remove filters.
To filter the Pivot view by an individual vector across the frozen dimensions, select the corresponding row in Frozen table.
Viewing Alternatives
You can find alternatives from all databases under Alternative:
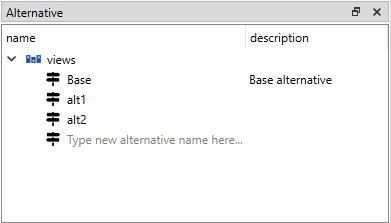
To view the alternatives from each database, expand the root item for that database.
Viewing Scenarios
You can find scenarios from all databases under Scenario tree:
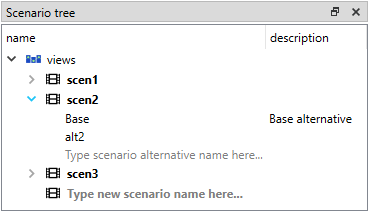
To view the scenarios from each database, expand the root item for that database. To view the alternatives for a particular scenario, expand the corresponding scenario item.
Viewing Parameter Value Lists
You can find parameter value lists from all databases under Parameter value list:
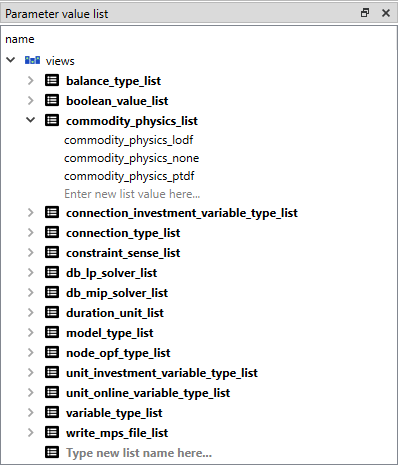
To view the parameter value lists from each database, expand the root item for that database. To view the values for each list, expand the corresponding list item.
Viewing Metadata
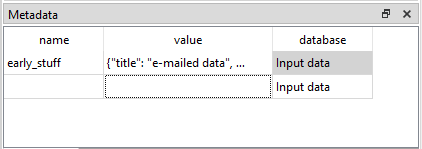
You can find metadata from all databases under Metadata:
See also Metadata description in Spine Database API documentation.
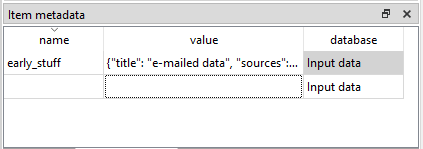
Viewing Item Metadata
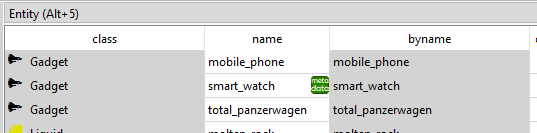
The entities and parameter values that have metadata associated with them get a metadata tag next to their names in Entity and Parameter value tables:
Item metadata shows the associated metadata when any cell on a tagged row is selected:
Viewing Parameter Groups
You can find parameter groups from all databases under Parameter group:
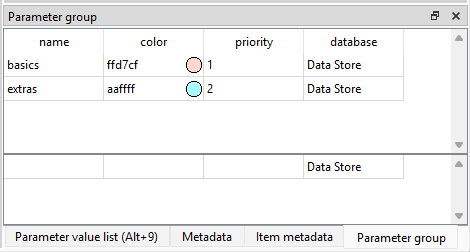
The view works very similar to the other table views.