Plotting
Basic data visualization is available in the Spine database editors. Currently, it is possible to plot plain parameter values as well as time series and maps.
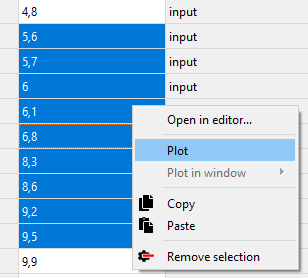
To plot a column, select the values from a table and then Plot from the right click popup menu.
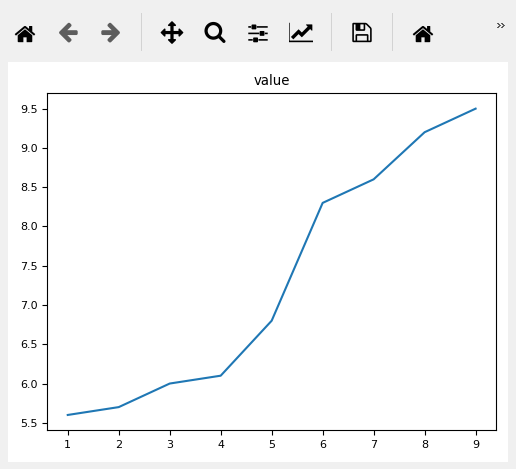
Selecting data in multiple columns plots the selection in a single window.
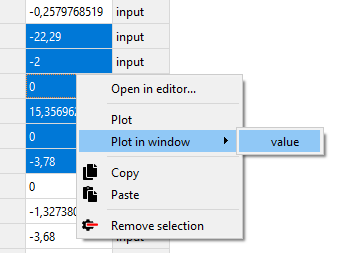
It is possible to add a plot to an existing plot window. Select the target plot window from the Plot in window submenu and the data will be added to the plot.
X axis for plain values
It is possible to plot plain values against X values given by a designated column in the pivot table.
To set a column as the X column right click the top empty area above the column header and select Use as X from the popup menu. An (X) in the topmost cell indicates that the column is designated as containing the X axis.
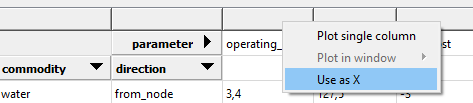
When selecting and plotting other columns in the same table the data will be plotted against the values in the X column instead of row numbers.