Viewing data
This section describes the available tools to view data.
Viewing entities and classes
Using Entity trees
Entity trees present the structure of classes and entities in all databases in the shape of a tree:

In Object tree:
To view all object classes from all databases, expand the root item (automatically expanded when loading the form).
To view all objects of a class, expand the corresponding object class item.
To view all relationship classes involving an object class, expand any objects of that class.
To view all relationships of a class involving a given object, expand the corresponding relationship class item under the corresponding object item.
In Relationship tree:
To view all relationship classes from all databases, expand the root item (automatically expanded when loading the form).
To view all relationships of a class, expand the corresponding relationship class item.
Note
To expand an item in Object tree or Relationship tree, double-click on the item or press the right arrow while it’s active. Items in gray don’t have any children, thus they cannot be expanded. To collapse an expanded item, double-click on it again or press the left arrow while it’s active.
Tip
To expand or collapse an item and all its descentants in Object tree or Relationship tree, right click on the item to display the context menu, and select Fully expand or Fully collapse.
Tip
In Object tree, the same relationship appears in many places (as many as it has dimensions). To jump to the next ocurrence of a relationship item, either double-click on the item, or right-click on it to display the context menu, and select Find next.
Using Entity graph
Entity graph presents the structure of classes and entities from one database in the shape of a graph:

Tip
To see it in action, check out this video.
Building the graph
To build the graph, select any number of items in either Object tree or Relationship tree. What is included in the graph depends on the specific selection you make:
To include all objects and relationships from the database, select the root item in either Object tree or Relationship tree.
To include all objects of a class, select the corresponding class item in Object tree.
To include all relationships of a class, select the corresponding class item in Relationship tree.
To include all relationships of a specific class involving a specific object, select the corresponding relationship class item under the corresponding object item in Object tree.
To include specific objects or relationships, select the corresponding item in either Object tree or Relationship tree.
Note
In Entity graph, a small unnamed vertex represents a relationship, whereas a bigger named vertex represents an object. An arc between a relationship and an object indicates that the object is a member in that relationship.
The graph automatically includes relationships whenever all the member objects are included (even if these relationships are not selected in Object tree or Relationship tree). You can change this behavior to automatically include relationships whenever any of the member objects are included. To do this, enable Auto-expand objects via the Graph menu, or via Entity graph’s context menu.
Tip
To extend the selection in Object tree or Relationship tree, press and hold the Ctrl key while clicking on the items.
Tip
Object tree and Relationship tree also support Sticky selection, which allows one to extend the selection by clicking on items without pressing Ctrl. To enable Sticky selection, select Settings from the hamburger menu, and check the corresponding box.
Manipulating the graph
You can move items in the graph by dragging them with your mouse. By default, each items moves individually. To make relationship items move along with their member objects, select Settings from the hamburger menu and check the box next to, Move relationships along with objects in Entity graph.
To display Entity graph’s context menu, just right-click on an empty space in the graph.
To save the position of items into the database, select the items in the graph and choose Save positions from the context menu. To clear saved positions, select the items again and choose Clear saved positions from the context menu.
To hide part of the graph, select the items you want to hide and choose Hide from context menu. To show the hidden items again, select Show hidden from the context menu.
To prune the graph, select the items you want to prune and then choose Prune entities or Prune classes from the context menu. To restore specific prunned items, display the context menu, hover Restore and select the items you want to restore from the popup menu. To restore all prunned items at once, select Restore all from the context menu.
To zoom in and out, scroll your mouse wheel over Entity graph or use Zoom buttons in the context menu.
To rotate clockwise or anti-clockwise, press and hold the Shift key while scrolling your mouse wheel, or use the Rotate buttons in the context menu.
To adjust the arcs’ lenght, use the Arc length buttons in the context menu.
To rebuild the graph after moving items around, select Rebuild graph from the context menu.
To export the current graph as a PDF file, select Export graph as PDF from the context menu.
Note
Entity graph supports extended selection and rubber-band selection. To extend a selection, press and hold Ctrl while clicking on the items. To perform rubber-band selection, press and hold Ctrl while dragging your mouse around the items you want to select.
Note
Prunned items are remembered across graph builds.
To display an object or relationship item’s context menu, just right-click on it.
To expand or collapse relationships for an object item, hover Expand or Collapse and select the relationship class from the popup menu.
Viewing parameter definitions and values
Using Stacked tables
Stacked tables present object and relationship parameter data from all databases in the form of stacked tables:

To filter Stacked tables by any entities and/or classes, select the corresponding items in either Object tree, Relationship tree, or Entity graph. To remove all these filters, select the root item in either Object tree or Relationship tree.
To filter parameter definitions and values by certain parameter tags, select those tags in Parameter tag toolbar.
To apply a custom filter on a Stacked table, click on any horizontal header. A menu will pop up listing the items in the corresponding column:

Uncheck the items you don’t want to see in the table and press Ok. Additionally, you can type in the search bar at the top of the menu to filter the list of items. To remove the current filter, select Remove filters.
To filter a Stacked table according to a selection of items in the table itself, right-click on the selection to show the context menu, and then select Filter by or Filter excluding. To remove these filters, select Remove filters from the header menus of the filtered columns.
Tip
You can rearrange columns in Stacked tables by dragging the headers with your mouse. The ordering will be remembered the next time you open Spine DB editor.
Viewing parameter values and relationships
Using Pivot table and Frozen table
Pivot table and Frozen table present data for an individual class from one database in the form of a pivot table, optionally with frozen dimensions:

To populate the tables with data for a certain class, just select the corresponding class item in either Object tree or Relationship tree.
Selecting the input type
Pivot table and Frozen table support four different input types:
Parameter value (the default): it shows objects, parameter definitions, alternatives, and databases in the headers, and corresponding parameter values in the table body.
Index expansion: Similar to the above, but it also shows parameter indexes in the headers. Indexes are extracted from special parameter values, such as time-series.
Relationship: it shows objects, and databases in the headers, and corresponding relationships in the table body. It only works when selecting a relationship class in Relationship tree.
Scenario: it shows scenarios, alternatives, and databases in the header, and corresponding rank in the table body.
You can select the input type from the Pivot section in the hamburger menu.
Note
In Pivot table, header blocks in the top-left area indicate what is shown in each horizontal and vertical header. For example, in Parameter value input type, by default, the horizontal header has two rows, listing alternative and parameter names, respectively; whereas the vertical header has one or more columns listing object names.
Pivoting and freezing
To pivot the data, drag a header block across the top-left area of the table. You can turn a horizontal header into a vertical header and viceversa, as well as rearrange headers vertically or horizontally.
To freeze a dimension, drag the corresponding header block from Pivot table into Frozen table. To unfreeze a frozen dimension, just do the opposite.
Note
Your pivoting and freezing selections for any class will be remembered when switching to another class.
Filtering
To apply a custom filter on Pivot table, click on the arrow next to the name of any header block. A menu will pop up listing the items in the corresponding row or column:
Uncheck the items you don’t want to see in the table and press Ok. Additionally, you can type in the search bar at the top of the menu to filter the list of items. To remove the current filter, select Remove filters.
To filter the pivot table by an individual vector across the frozen dimensions, select the corresponding row in Frozen table.
Viewing alternatives and scenarios
You can find alternatives and scenarios from all databases under Alternative/Scenario tree:

To view the alternatives and scenarios from each database, expand the root item for that database. To view all alternatives, expand the alternative item. To view all scenarios, expand the scenario item. To view the alternatives for a particular scenario, expand the scenario_alternative item under the corresponding scenario item.
Viewing tools and features
You can find tools, features, and methods from all databases under Tool/Feature tree:

To view the features and tools from each database, expand the root item for that database. To view all features, expand the feature item. To view all tools, expand the tool item. To view the features for a particular tool, expand the tool_feature item under the corresponding tool item. To view the methods for a particular tool-feature, expand the tool_feature_method item under the corresponding tool-feature item.
Viewing parameter value lists
You can find parameter value lists from all databases under Parameter value list:

To view the parameter value lists from each database, expand the root item for that database. To view the values for each list, expand the corresponding list item.
Viewing parameter tags
You can find parameter tags from all databases under Parameter tag:
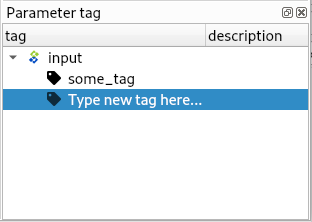
To view the tags from each database, expand the root item for that database.