Data store view
This section describes the different interfaces available in Data Store view for viewing and editing data in a Spine database.
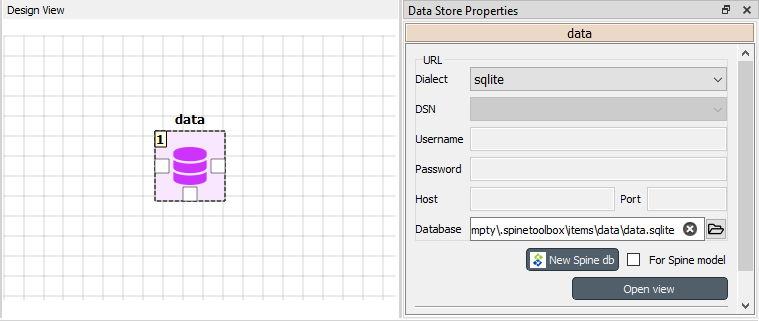
To open Data store view, select a Data Store and click the Open view button in its Properties:
Data store view consists of a number of dockable views that display the data in the database in different ways. Three pre-defined layouts or styles are available from the View menu:
- In Tree style layout (
 ) you can edit, add and remove all database entities and parameters
 - In Tabular style layout (
 ) you can display the the data in a pivot table
 - In Graph style layout (
 ) you can view the structure of classes, objects and relationships
in a graph representation
) you can view the structure of classes, objects and relationships
in a graph representation
Commit/Rollback changes
Changes are not immediately saved to the database. They need to be committed separately. To do that select Session -> Commit from the menu bar, enter a commit message and press Commit. Any changes made in the Data store view will be saved into the database.
To undo any changes since the last commit, select Session -> Rollback from the menu bar.
Tree style
The Tree style layout is useful to get an overview of the data and the relationships within a Spine database:
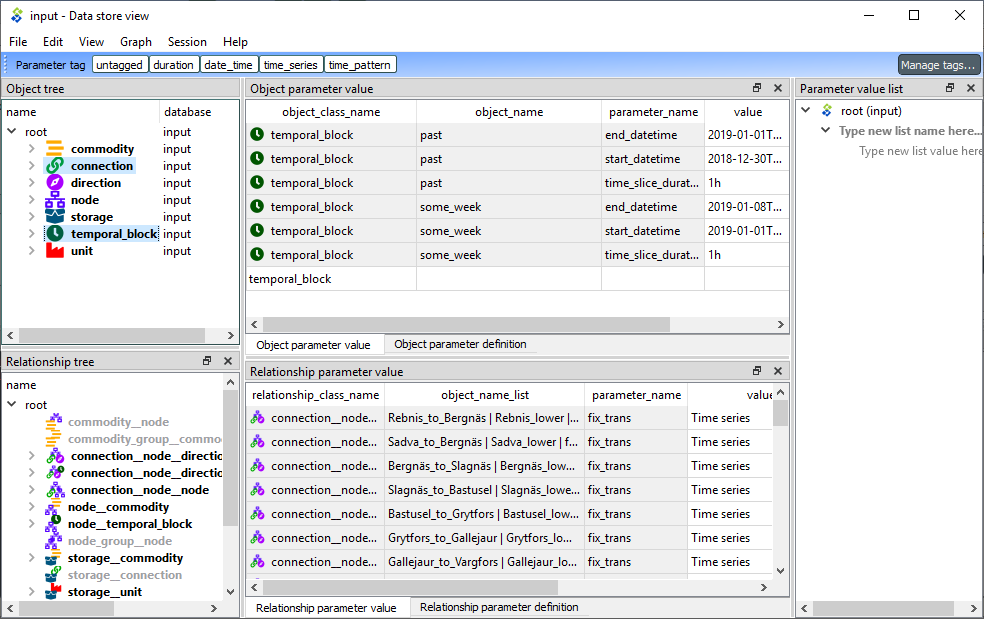
In the default Tree style layout the left side of the Data store view is occupied by two tree views which display the different object and relationship classes, with their objects and relationships in a hierarchical tree. These and the other views allow you to add, edit, and delete object classes, relationship classes, objects, relationships, parameters and parameter values.
The interface has five main components:
- Object tree, where you can expand and collapse the different levels of the hierarchy. It also acts as a filtering tool for the two table components, so that only items selected in the Object tree are shown in the Parameter tables.
- Relationship tree, similar to Object tree but for relationships.
- Object parameter value table, where you can view, add, edit, and delete object parameter definitions and values.
- Relationship parameter value table, where you can view, add, edit, and delete relationship parameter definitions and values.
- Parameter value list allows you to create value lists that can be associated to parameter definitions.
Editing items
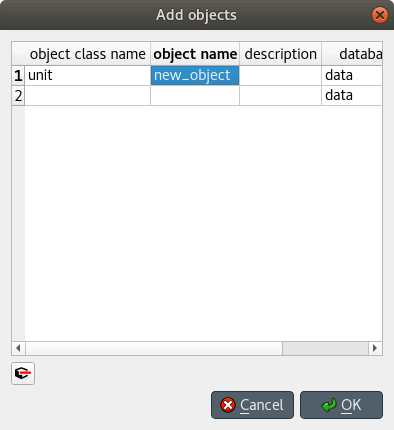
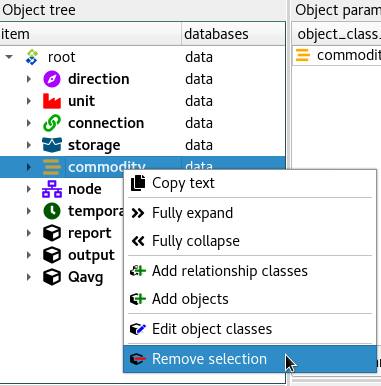
To add object classes, relationship classes, objects or relationships you can use the Edit menu from the main menu bar, as well as the context menu from the Object tree. In the dialog that pops up you can enter new items by typing their names or pasting data from the clipboard.
To delete an item, you can again use the Edit menu from the main menu bar or the item’s context menu from the Object tree.
Editing items is done following a similar procedure.
Viewing parameter definitions and values
In the Parameter tables, you can switch between viewing parameter definitions or values by using the tabs in the lower left corner.
You can also (further) filter the tables by clicking on the column headers.
Editing parameters definitions and values
To add new parameter definitions or values you can directly do it in the last row of each table. The tables also support pasting values from the clipboard.
Tabular style
The Tabular style layout is used to display and edit data in a Spine database via a table-like interface. The interface lets you filter and pivot the data for exploration and editing.
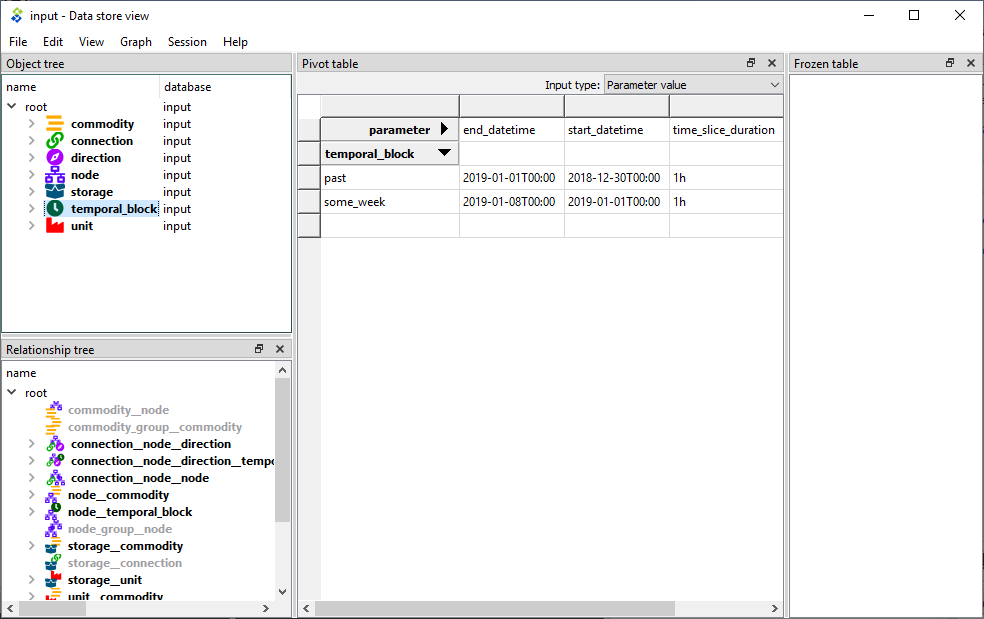
The interface has four main components:
- Object tree, where you can expand and collapse the different levels of the hierarchy. The item selected in the Object tree is shown in the Pivot table.
- Relationship tree, similar to Object tree but for relationships.
- Pivot table, where you can transform the data view by dragging and dropping the header blocks. You can choose, e.g., which items go into rows and which into columns.
- Frozen table: dragging header blocks here freezes the selected items in the Pivot table.
From the drop-down Input type list at the top of the Pivot table, you can select two different input types:
- Parameter value: display all objects (or relationships), as well as all parameters and parameter values for the selected object (or relationship) class.
- Relationship: display only the objects (or relationships) for the selected object (or relationship) class.
Pivoting and filtering data
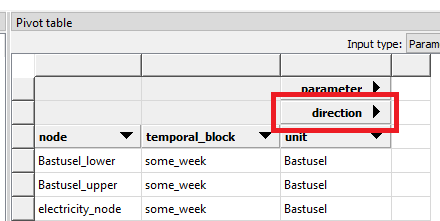
You can transform (pivot) the data view by dragging header blocks across the Pivot table and to Frozen table:
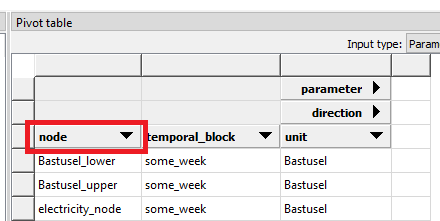
When you drag a header block in Pivot table in a column header position like the ‘node’ header below, items under that header are displayed in that column of the Pivot table so there is a unique row for each item.
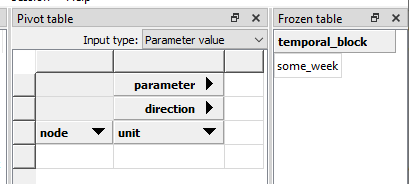
When you drag a header block in Pivot table in a row header position like the ‘direction’ header below, items under that header are displayed in that row of the Pivot table.
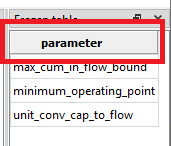
When you drag a header block to the Frozen table all items in under the header are excluded from the Pivot table and shown in the Frozen table instead. The Pivot table is then filtered by the selected item in the Frozen table.
To filter a specific item you can use the filter buttons in the header blocks. It is possible to apply multiple filters at the same time.
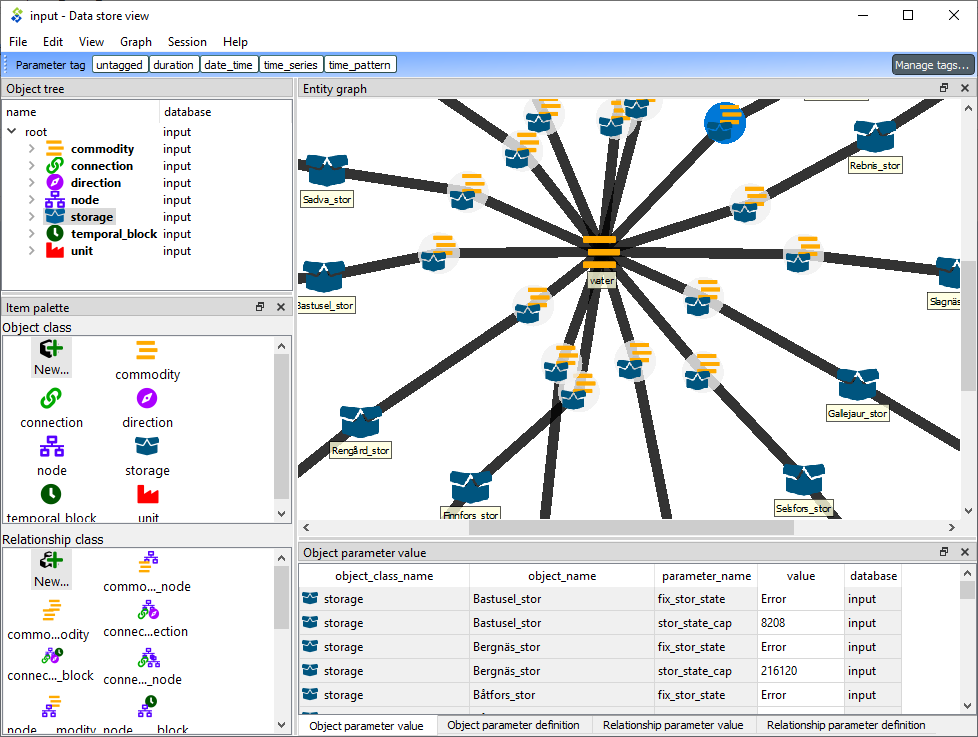
Graph style
The Graph style layout is used to visualize the Spine database structure into a graph. Here you can select objects to see how they are related. You can also view parameter definition and values same as in the Tree style layout.